National Summary – Pasture recovery stalls in the south as northern regions rebound
Extreme climate variability continues to define Australia’s feedbase, with contrasting conditions between the country’s wetter north and drier southern and central regions. While recent rainfall has bolstered pasture biomass across parts of Queensland, New South Wales, and southeastern Australia, prolonged moisture deficits in South Australia, Western Australia, and western Victoria are intensifying pasture stress. The latest observations highlight a widening gap between regions experiencing recovery and those grappling with persistent dryness.
According to the Bureau of Meteorology (BoM), February 2025 ranked as the fifth-warmest February on record, with a national mean temperature 1.64°C above the long-term average. Both maximum (+2.08°C) and minimum (+1.19°C) temperatures were well above average, accelerating soil moisture loss and pasture deterioration, particularly in the inland grazing zones. Above-average rainfall in the east and northwest helped sustain pasture growth, yet large parts of central and southern Australia remained dry, limiting biomass retention and feed availability.
Late-February heatwaves have further stressed pastures, particularly in Western Australia’s Pilbara region, where biomass retention and ground cover continue to decline. The most recent Total Standing Dry Matter (TSDM) maps for March 2025 maps confirm the ongoing divide in pasture conditions, with northern and eastern Australia maintaining higher biomass levels, while southern and inland regions remain under sustained dryness, restricting pasture recovery.
![]()
Imagery and analysis provided by CiboLabs
February Total Standing Dry Matter
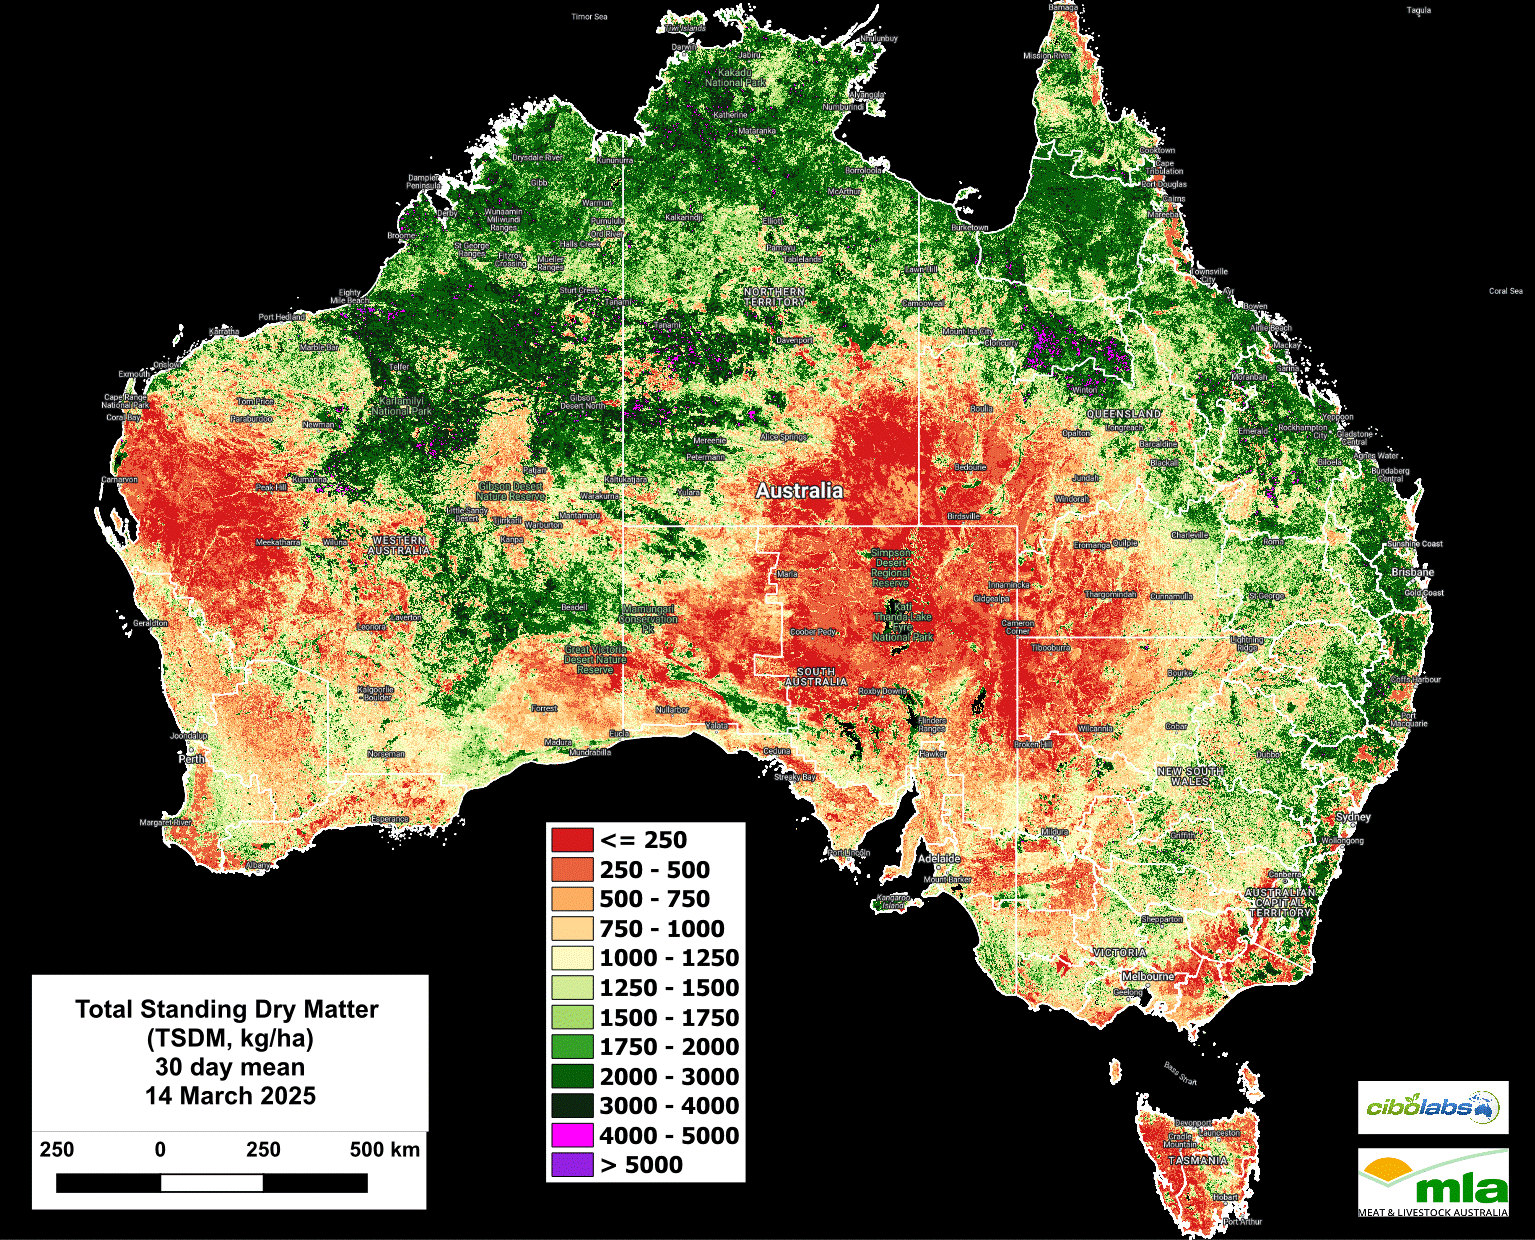
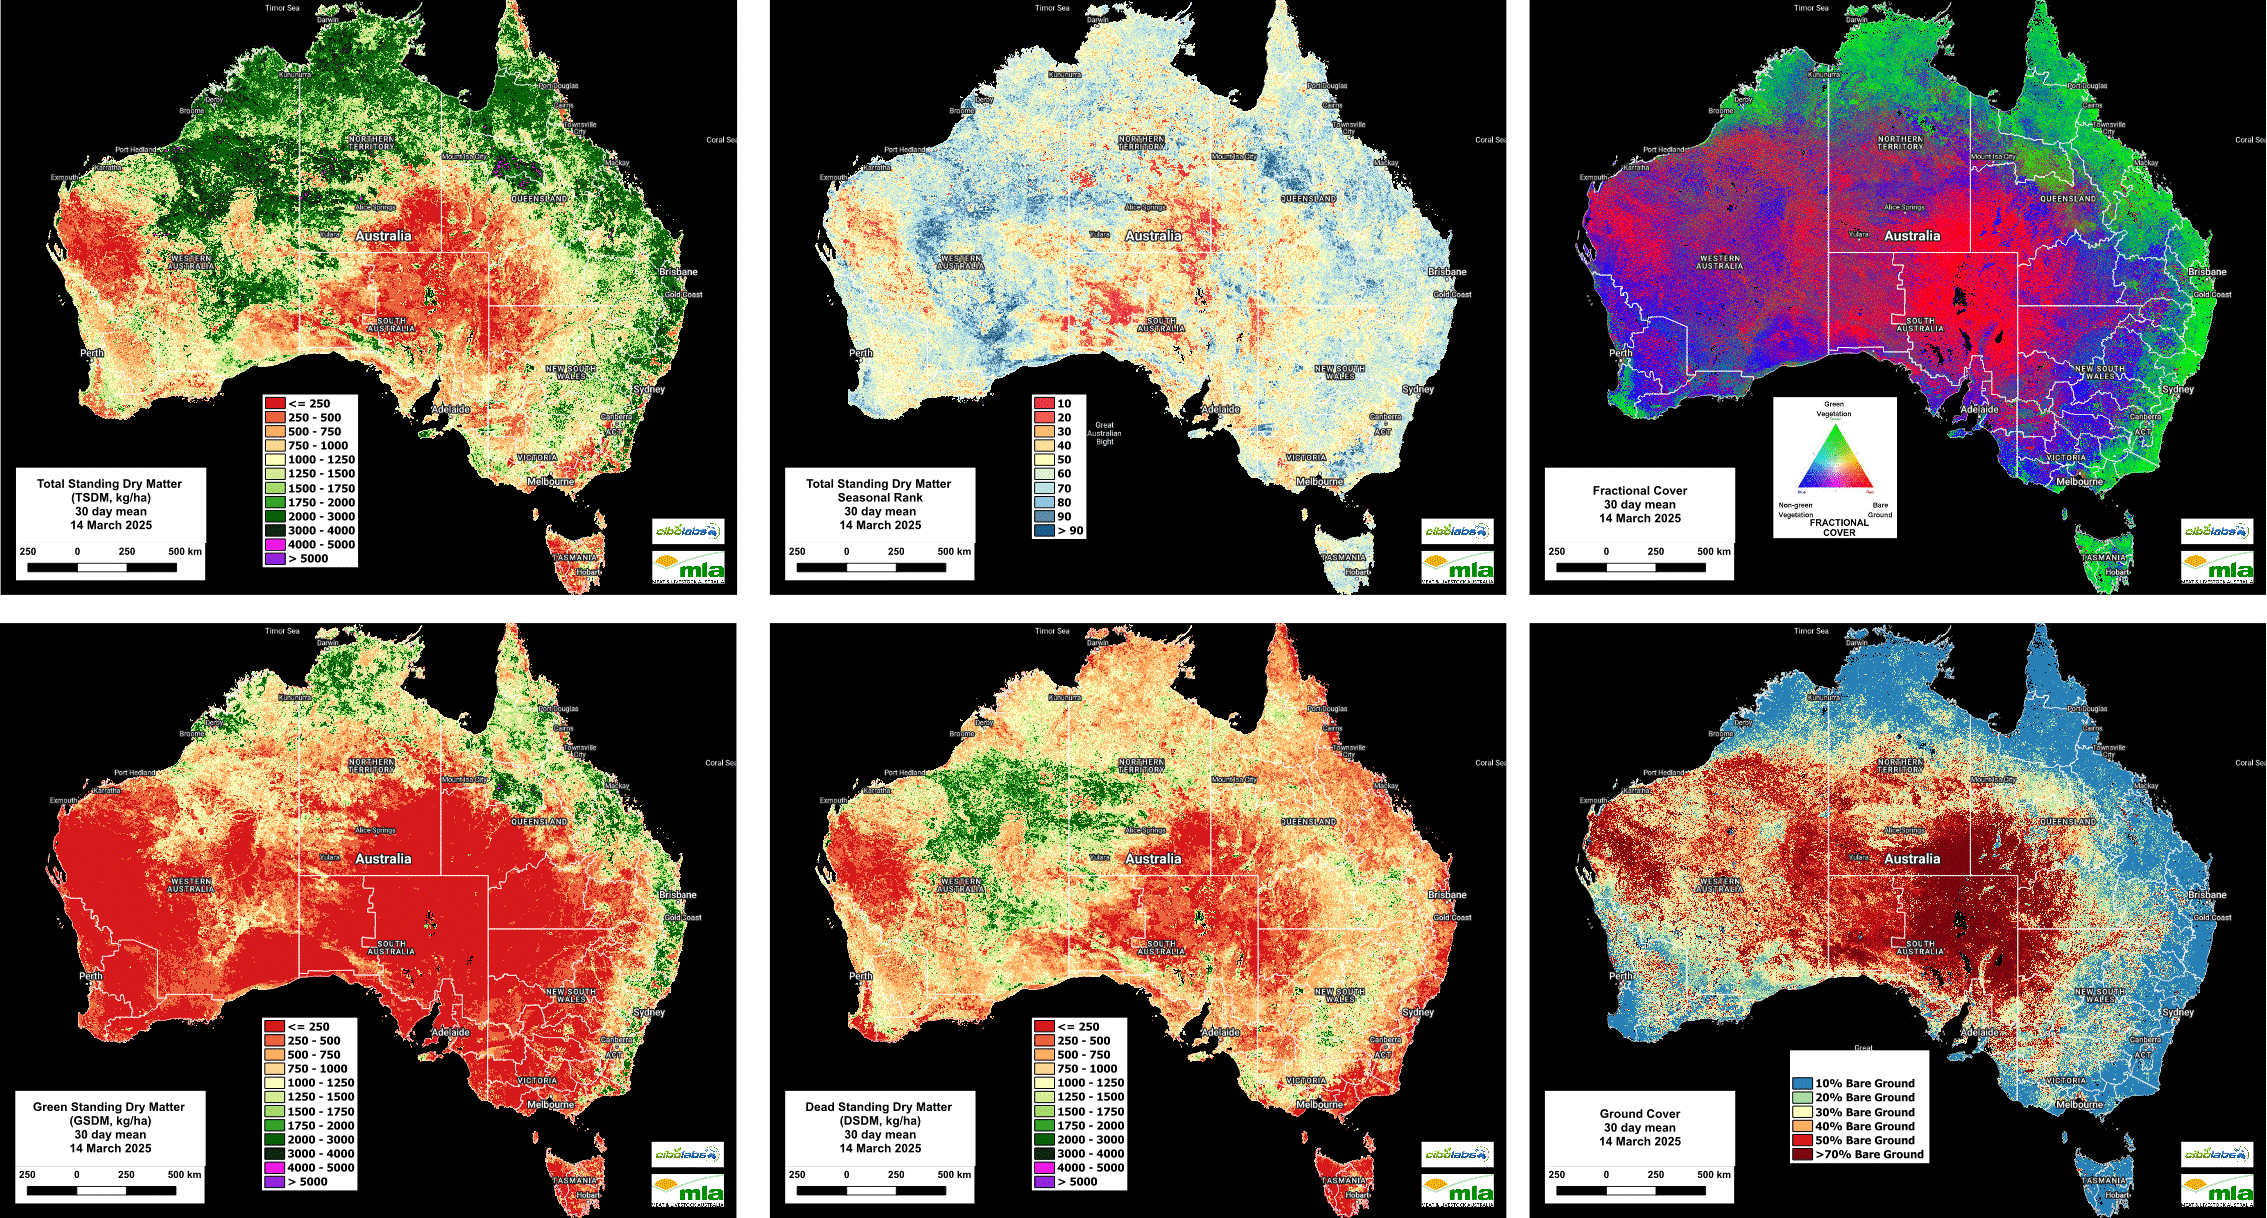
Image 1 – Total Standing Dry Matter (Kg/Ha)
The March 2025 Total Standing Dry Matter (TSDM) maps highlight a continued contrast between high pasture biomass in the north and east and worsening dryness across southern and central regions.
- Northern & Eastern Australia: Biomass continues to remain high across Queensland and New South Wales, with many grazing regions still exceeding 1250–1750 kg DM/ha. Northern Queensland and the Top End (Cooktown, Charters Towers, Katherine) remain strong, with biomass levels above 2000 kg DM/ha in many areas. However, drying are emerging in parts of central NSW and southern QLD.
- Western Australia: Little improvement—inland and southern regions remain critically dry, with biomass mostly below 750 kg DM/ha. Coastal districts, including Esperance and Albany, have seen small gains, but overall, moisture stress remains a challenge. The Kimberley continues to hold strong, benefiting from wet-season growth.
- Central & Northern Australia: The Top End, Cape York, and northern Queensland continue to maintain strong pasture growth (1500–2000 kg DM/ha). However, central Australia remains severely dry (<500 kg DM/ha), with no major improvements seen across the Alice Springs region and surrounding areas.
- Victoria & Southeastern SA: Pasture conditions have deteriorated in many areas, with biomass levels falling back below 750–1000 kg DM/ha in parts of western and central Victoria. Hamilton and Horsham grazing areas, which had previously improved, have dried again, with more regions now showing signs of moisture stress. In Southeastern SA, some gradual improvement continues near Mount Gambier and Naracoorte, but overall biomass levels remain low.
- Southeastern Australia & Tasmania: Tasmania has dried significantly, with widespread declines in biomass across grazing regions. Many areas that were in the 1250–2000 kg DM/ha range in February are now below 750 kg DM/ha, particularly in the south and east. Gippsland and northeastern Tasmania still retain higher biomass (1250–2000 kg DM/ha), but the drying trend is evident across much of the region.
Decile Rankings and Seasonal Comparisons
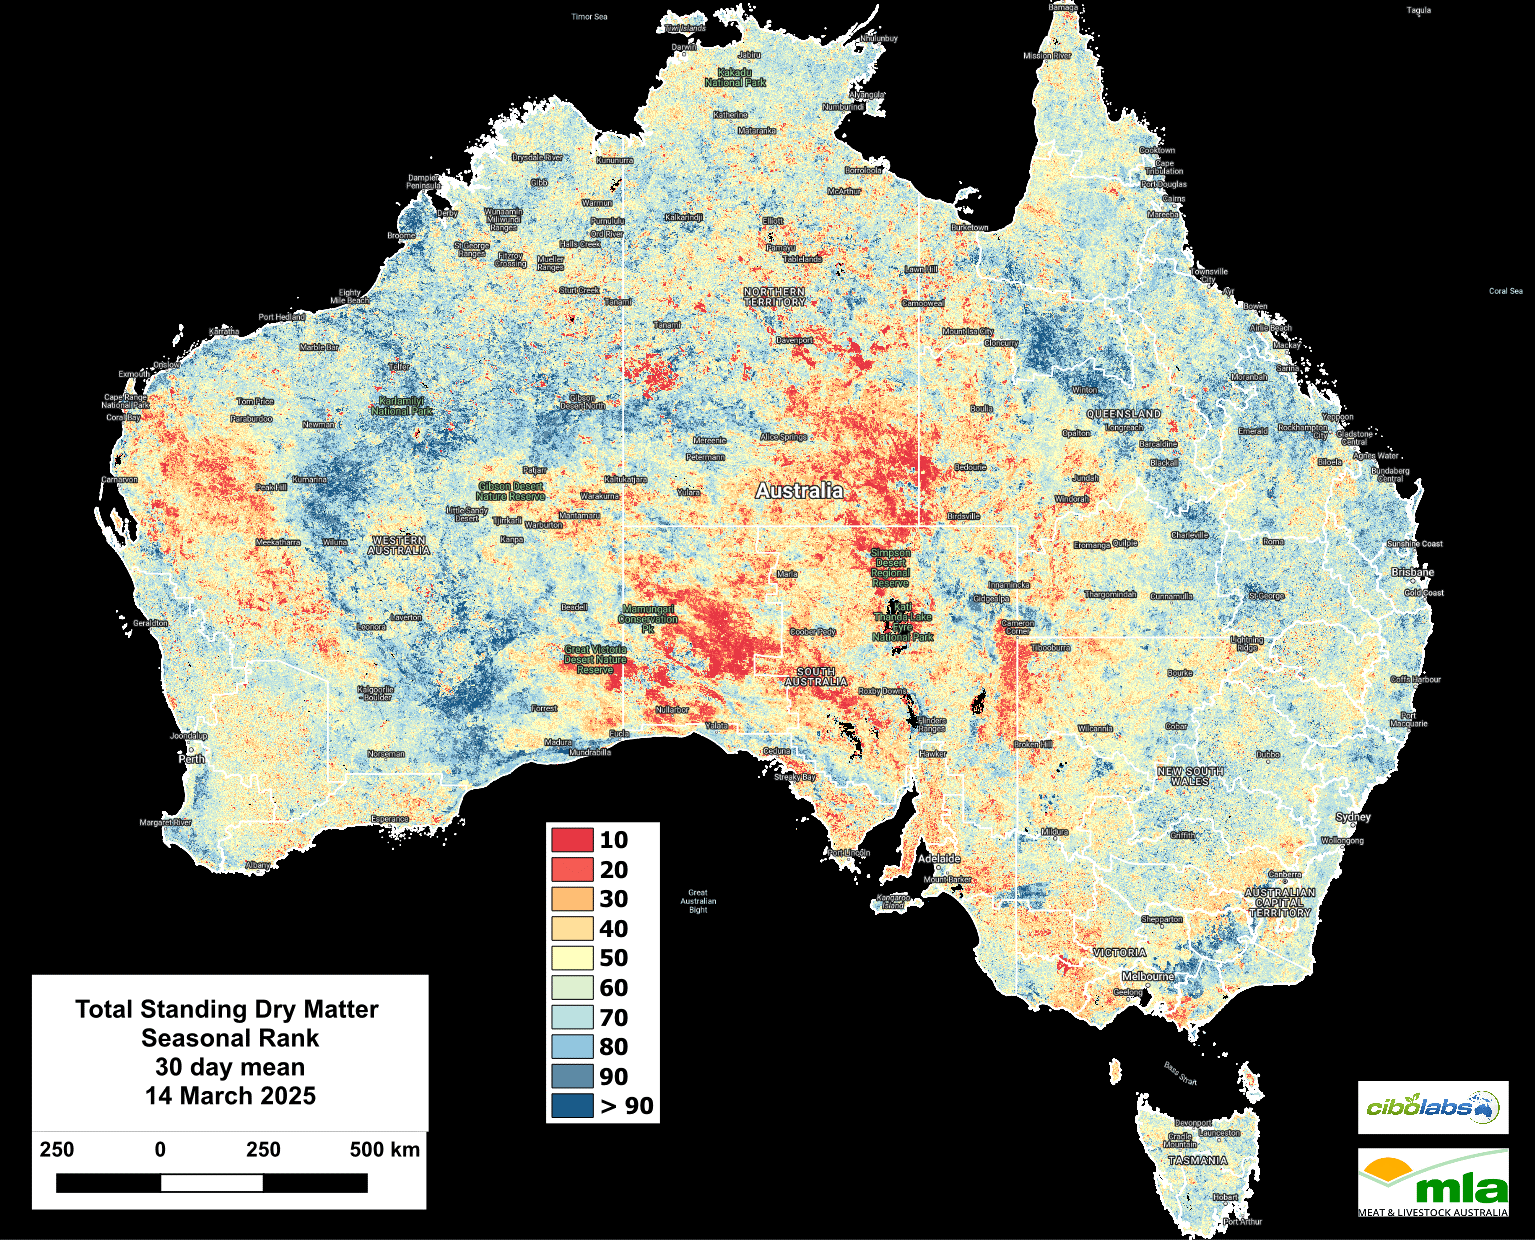
Image 2 – Seasonal Comparison Total Standing Dry Matter
Total Standing Dry Matter (TSDM) seasonal rankings for March 2025 highlight shifting pasture trends across Australia, with notable improvements in some regions and ongoing challenges in others. Victoria, New South Wales, Tasmania, and Queensland continue to show above-average pasture conditions, with many regions in the 6–9 decile range. Parts of Southwest Victoria, Gippsland, Northern NSW, and Eastern Queensland are now exceeding the 90th percentile, reflecting strong seasonal conditions.
Western Australia remains in a deteriorating trend, with inland areas and large parts of the southern rangelands slipping below the 40th percentile. The northern pastoral regions, however, have seen some localized improvement.
Regional Insights
- Southeastern Australia: Southwest Victoria and parts of Tasmania continue to hold in the 70–90 decile range, with pockets surpassing the 90th percentile. Eastern NSW remains in average to above-average conditions.
- South Australia: While southeastern SA aligns with Victoria’s positive trends, the interior remains in the lowest deciles (10–30), reflecting ongoing moisture deficits and limited pasture recovery.
- Central Australia: The Simpson Desert, Great Victoria Desert, and arid interior regions remain in the lowest deciles (<10). Some localized areas have seen minor gains following isolated rainfall events.
- Northern Australia: Northern Queensland and the Top End continue to benefit from monsoonal activity, pushing large areas into the 50–80 decile range. Cape York and the Gulf region show notable gains.
- Southwestern WA: Persistent moisture stress has kept much of Southwestern WA in the lowest deciles (<20), with limited recovery in the wheatbelt and grazing lands.
Updated Proportion of Below, and Above Average Decile Areas by State
Fractional Cover and Vegetation Trends
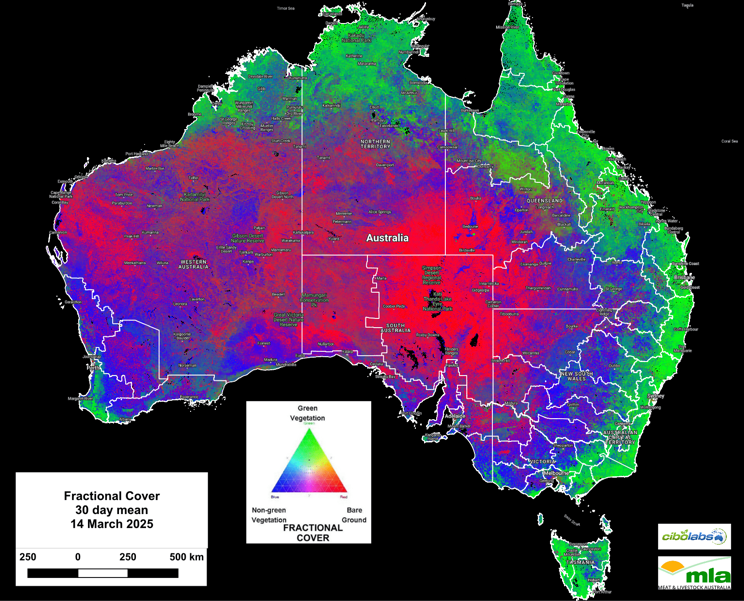
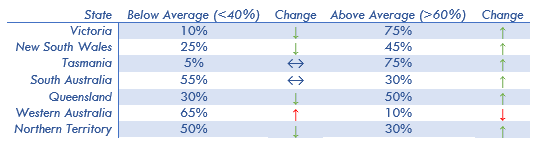
Image 3 – Fractional Cover
The latest Fractional Cover maps (22 February – 14 March 2025) illustrate key vegetation trends across Australia:
- Northern Australia: Green vegetation continues to expand across Queensland and the Top End, driven by monsoonal rainfall. Northern WA and the NT exhibit noticeable growth, particularly in the Kimberley and Arnhem regions.
- Eastern Australia: New South Wales, Victoria, and Queensland maintain high levels of green vegetation, reflecting sustained pasture availability. The eastern slopes and coastal regions remain in strong condition, with only minor drying trends inland.
- South Australia: While southeastern regions show some growth, the majority of the state remains dominated by non-green vegetation and bare ground. Interior South Australia, particularly around the Flinders Ranges and Lake Eyre, shows little sign of recovery.
- Western Australia: The southwest agricultural zone has experienced localized growth near the coast, but inland areas remain dry, with significant non-green vegetation and exposed ground. Northern WA shows strong green responses, particularly in the Pilbara and Kimberley regions.
- Central Australia: Large expanses remain in a bare-ground state, with minimal vegetation response. The Simpson Desert and surrounding arid zones continue to show limited improvement despite recent rainfall events in some areas.
These patterns highlight the regional contrasts in pasture availability and ongoing dry conditions in parts of SA, WA, and Central Australia.
Green Standing Dry Matter (GSDM): Vegetation Recovery
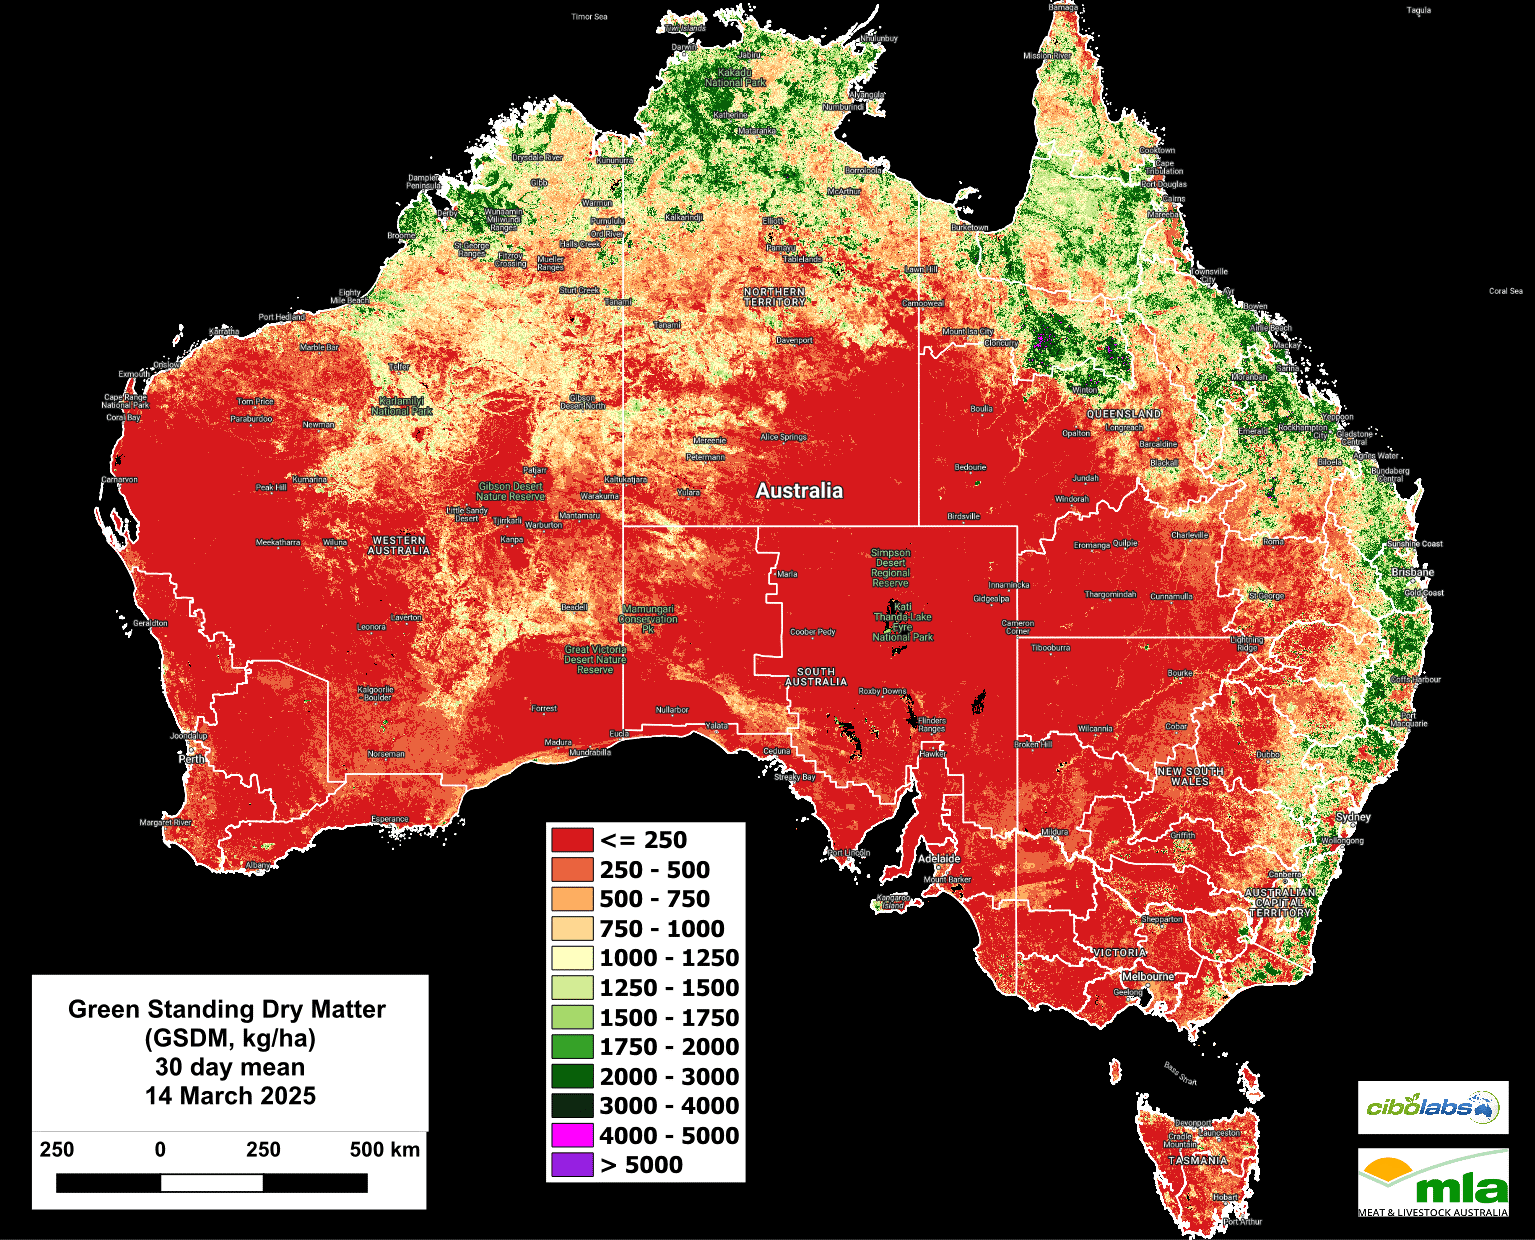
Image 4 – Green Standing Dry Matter
GSDM maps for March 2025 highlight ongoing variability in pasture conditions across Australia, with notable dry conditions persisting in many regions.
- Southeastern Australia: Green biomass has declined slightly across New South Wales, Victoria, and Tasmania, with some areas in southwest Victoria maintaining reasonable biomass levels (>2000 kg DM/ha), though some areas have shown reductions.
- Western Victoria & Southeastern SA: Some further decline in biomass is evident, with Mount Gambier and Naracoorte now mostly in the 1000–1500 kg DM/ha range, reflecting a drying trend.
- Northern Australia: Strong increases in green biomass remain evident, particularly in northern Queensland (Hughenden, Charters Towers, and Richmond), parts of the NT (Katherine region), and the Kimberley, with areas exceeding 2000 kg DM/ha. However, drier patches have emerged in the southern NT and western QLD.
- Southwestern WA: Severe moisture stress persists, with inland areas remaining below 500 kg DM/ha. Coastal zones, including parts of the Great Southern region, show minor improvements, but widespread low biomass levels remain.
- Central Australia: Conditions have deteriorated further, with Alice Springs, Tennant Creek, and most of inland SA remaining below 250 kg DM/ha. No significant recovery has been observed.
Dead Standing Dry Matter (DSDM)
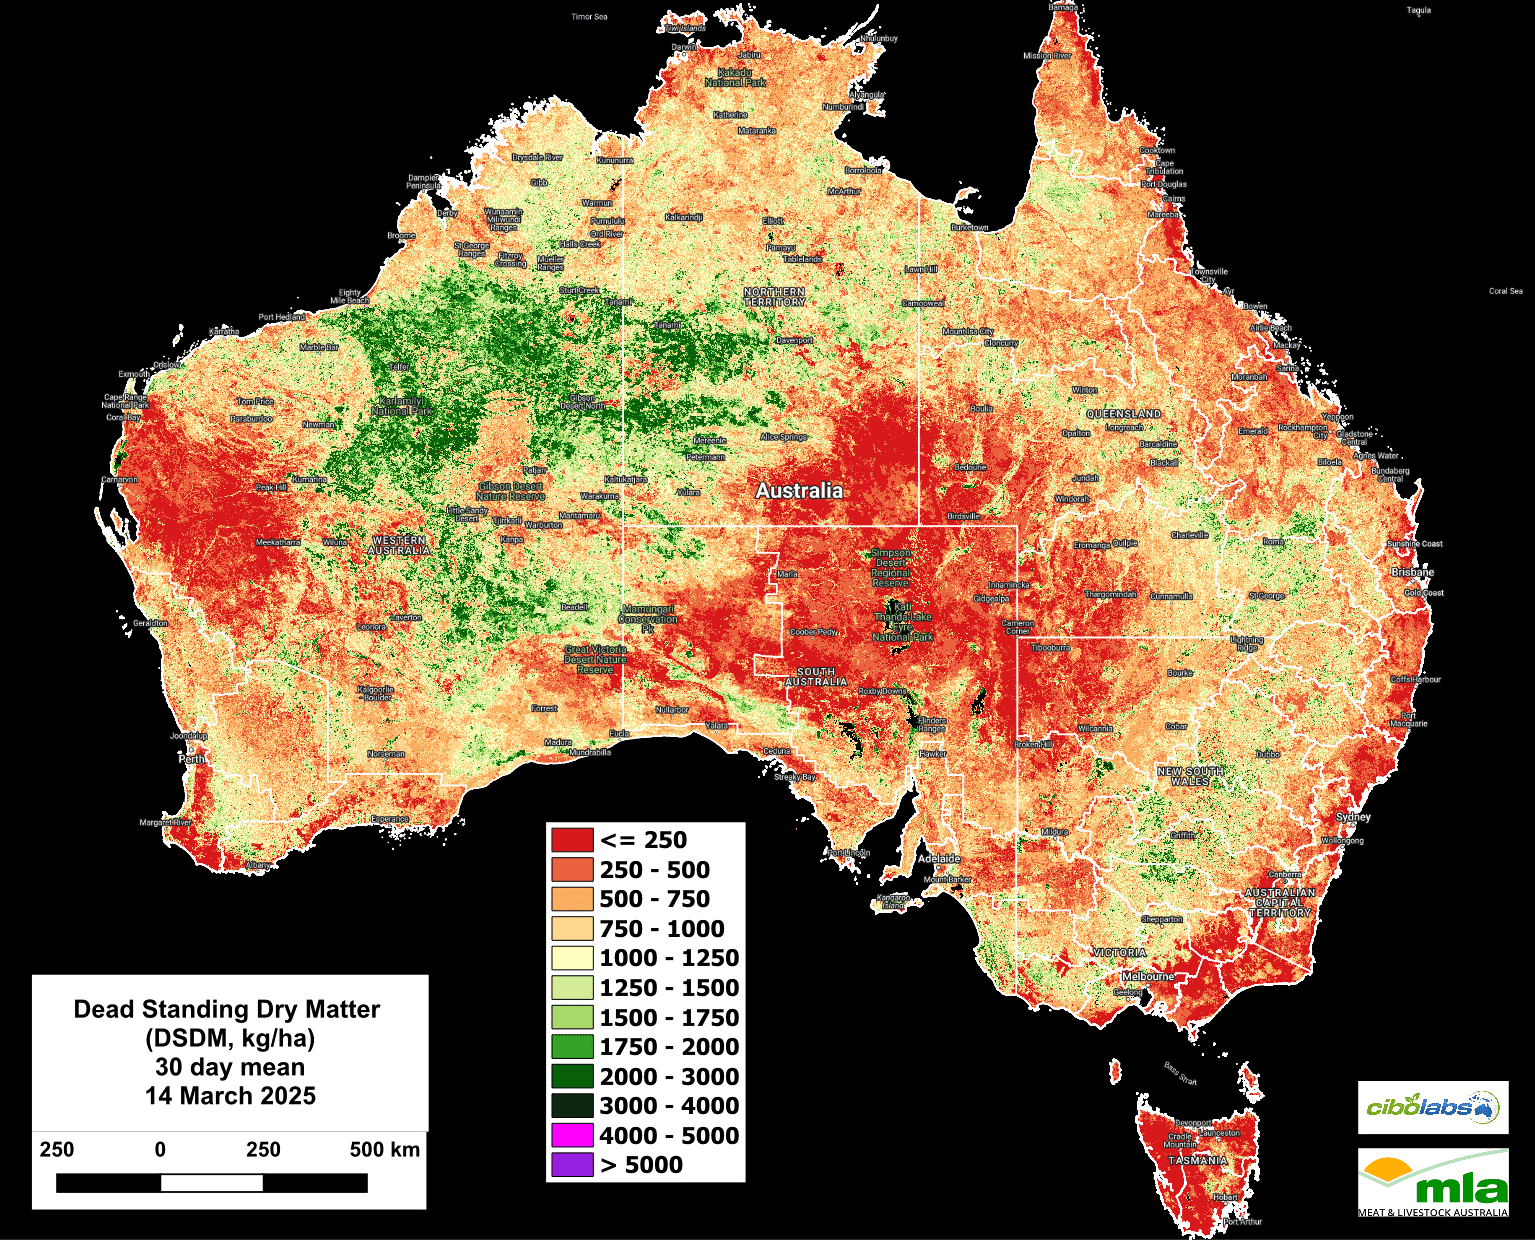
Image 5 – Dead Standing Dry Matter
Based on the latest Dead Standing Dry Matter (DSDM) maps, the following trends are observed:
- Northern Australia (NT, QLD, WA): Dead biomass has increased in some areas, particularly across northern Queensland and the Northern Territory, where patches of 750–2000 kg DM/ha persist. However, reductions are evident in areas that have experienced rainfall, such as parts of northern WA and the Barkly region, where decomposition and new growth have reduced residual dead biomass.
- Southern States (VIC, TAS, SA): Dead biomass remains low, with Victoria, Tasmania, and southeastern South Australia continuing to show minimal dead standing dry matter, reflecting ongoing pasture turnover and green biomass dominance.
- Central Australia: Dead biomass levels remain critically low (<250 kg DM/ha), consistent with persistent arid conditions and limited recent rainfall. The region continues to experience low standing biomass, reinforcing feed shortages.
- Western & Northern WA: Some pockets of dead biomass persist in inland regions, but progressive reductions are observed, particularly in the Kimberley and Pilbara, where recent moisture has contributed to biomass decomposition and green pasture regeneration.
These patterns indicate that rainfall and temperature shifts are driving further decomposition of dead biomass, particularly in northern and western regions, while pasture conditions in the south remain largely stable.
Ground Cover and Vegetation Density
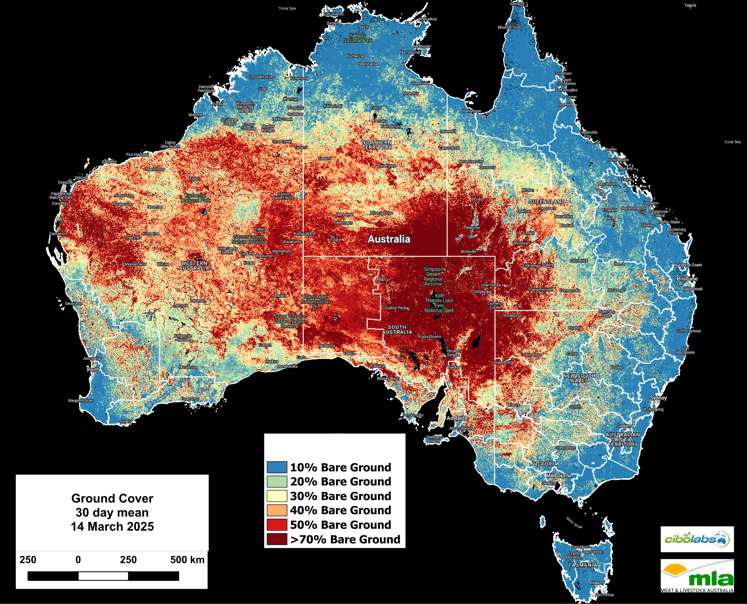
Image 6 – Ground Cover
- Central Australia: Extensive bare ground (>70%) remains prevalent across Alice Springs, Tennant Creek, and surrounding regions, with further deterioration in some areas due to ongoing arid conditions and limited pasture recovery.
- Western Australia: Bare ground continues to expand across inland and rangeland areas, particularly in the Gascoyne, Murchison, and Goldfield’s regions, where dry conditions and limited regrowth persist. Southwestern WA shows localized stability, with some coastal and higher-rainfall areas maintaining moderate to high ground cover.
- Northern Australia: Ground cover remains stable, but localized drying is evident, particularly in parts of western Queensland, the Barkly Tableland, and the Top End, as seasonal drying begins to take effect in some grazing areas.
- Southeastern Australia: High ground cover (>80%) remains dominant in Victoria, southeastern South Australia, and southeastern Queensland, reflecting strong pasture growth and continued favourable seasonal conditions. However, there are drying trends emerging in parts of western NSW and central Queensland, where pasture conditions have begun to mature and senesce.
For localized information, users can explore the Cibo Labs Regional Comparison tool, which offers insights into the impacts of local weather and fire events on regional data. Detailed views for individual properties are accessible via the Australian Feedbase Monitor through the MyMLA portal or the Cibo Labs website. These tools enable land managers to make data-informed decisions tailored to their unique feedbase conditions and needs.
For more localised information including regional level overviews, users are encouraged to explore the Cibo Labs Regional Comparison. This tool provides regional data that may show the impact of localised weather or fire events. A further level of detail for individual properties is available for users who have created an Australian Feedbase Monitor account, which can be accessed both through the MyMLA portal or through the Cibo Labs website. These tools enable land managers to make data-informed decisions tailored to their unique feedbase conditions and needs.
The Cibo Labs National Comparison can be used to freely access these layers (https://www.cibolabs.com.au/products/national-comparsion/) to view the most recent images from a national, state or catchment level.
This tool can complement the Australian Feedbase Monitor which can also be created within the Cibo Labs Web Site www.cibolabs.com.au
HAVE YOUR SAY