

Nova Leap Health Corp. Posts Q2 2024 Results that include a Continuation of Strong Operating Results, a Strong Balance Sheet and the Re-engagement of M&A
/EIN News/ -- NOT FOR DISSEMINATION IN THE UNITED STATES OR FOR DISTRIBUTION TO U.S. NEWSWIRE SERVICES
HALIFAX, Nova Scotia, Aug. 08, 2024 (GLOBE NEWSWIRE) -- NOVA LEAP HEALTH CORP. (TSXV: NLH) (“Nova Leap” or “the Company”), a growing home health care organization, is pleased to announce the release of financial results for the quarter ended June 30, 2024. All amounts are in United States dollars unless otherwise specified.
Nova Leap Q2 2024 Financial Results
Financial results for the second quarter ended June 30, 2024 include the following:
- Nova Leap recorded positive Net Income, positive Adjusted EBITDA, positive net cash flows, completed one acquisition and maintained borrowing capacity for future acquisitions with no bank debt.
- Q2 was the Company’s 10th consecutive quarter with positive Adjusted EBITDA and 5th consecutive quarter of positive operating income.
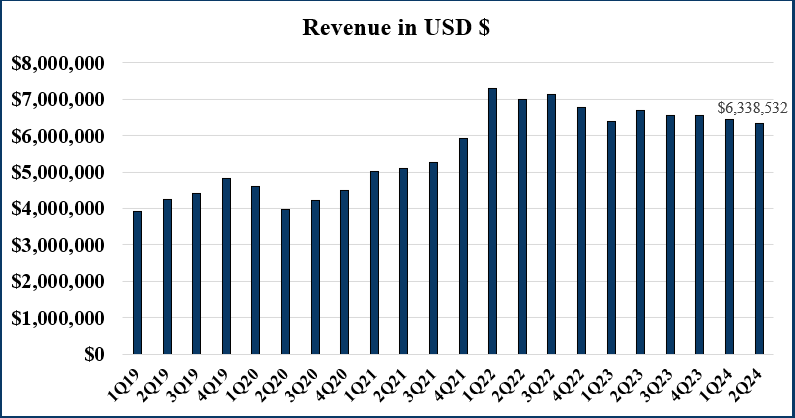
- Q2 2024 revenues of $6,338,532 decreased by 1.4% relative to Q1 2024 revenues of $6,429,721 and by 5.1% relative to Q2 2023 revenues of $6,677,360.
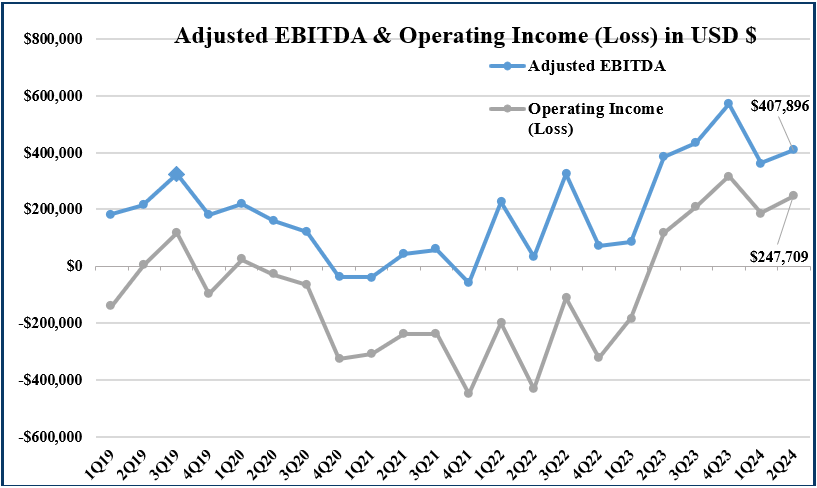
- Q2 2024 Adjusted EBITDA of $407,896 was an increase of 12.7% over Q1 2024 Adjusted EBITDA of $361,802 and an increase of 5.6% over Q2 2023 Adjusted EBITDA of $386,084 (see calculation of Adjusted EBITDA below).
- Adjusted EBITDA for the 12-month period from Q3 2023 to Q2 2024 was $1,775,160.
- Gross profit margin as a percentage of revenues remained strong at 38.4% in Q2 2024. Gross profit margin percentage was 38.0% in Q1 2024 and 36.8% in Q2 2023.
- The Company generated income from operating activities in Q2 2024 of $247,709, an increase of $61,000 from Q1 2024 and $131,047 from Q2 2023.
- The Company recorded net income of $226,998 in Q2 2024 as compared to net income of $473,073 in Q1 2024 and a net loss of $183,501 in Q2 2023.
- The Company generated cash flow from operating activities of $387,709 in Q1 2024 compared to $374,304 in Q1 2024 and $664,685 in Q2 2023.
- On May 3, 2024, the Company acquired the business assets of a home care services company located in Massachusetts, United States. Under the terms of the agreement, the acquisition was for total consideration of $300,000 of which $250,000 was payable with cash on closing and $50,000 by way of a promissory note repayable over a two-year period.
- The Company had available cash of $1,165,368 as of June 30, 2024 as well as full access to the unutilized revolving credit facility of $1,095,930 (CAD$1,500,000). The Company’s cash balance increase during the second quarter, despite investing $250,000 in the Massachusetts acquisition.
President & CEO’s Comments
“This was another steady quarter for the Company as we increased quarterly Adjusted EBITDA and re-engaged our acquisition program with a small acquisition mid-quarter”, said Chris Dobbin, President & CEO of Nova Leap. “As a company, we produced positive operating results, generated positive cash flow and have no outstanding bank debt. We are actively working on acquisition opportunities where we have the ability to utilize the Company’s borrowing capacity”
This news release should be read in conjunction with the Unaudited Condensed Interim Consolidated Financial Statements for the three and six months ended June 30, 2024 and 2023 including the notes to the financial statements and Management's Discussion and Analysis dated August 8, 2024, which have been filed on SEDAR+.
About Nova Leap
Nova Leap is an acquisitive home health care services company operating in one of the fastest-growing industries in the U.S. & Canada. The Company performs a vital role within the continuum of care with an individual and family centered focus, particularly those requiring dementia care. Nova Leap achieved the #42 ranking on the 2021 Report on Business ranking of Canada’s Top Growing Companies, the #2 ranking on the 2020 Report on Business ranking of Canada’s Top Growing Companies and the #10 Ranking in the 2019 TSX Venture 50™ in the Clean Technology & Life Sciences sector. The Company is geographically diversified with operations in 10 different U.S. states within the New England, Southeastern, South Central and Midwest regions as well as in Nova Scotia, Canada.
NON-IFRS AND OTHER MEASURES:
This release contains references to certain measures that do not have a standardized meaning under IFRS as prescribed by the International Accounting Standards Board (“IASB”) and are therefore unlikely to be comparable to similar measures presented by other companies. Rather, these measures are provided as additional information to complement IFRS measures by providing a further understanding of operations from management’s perspective. Accordingly, non-IFRS financial measures should not be considered in isolation or as a substitute for analysis of financial information reported under IFRS. The Company presents non-IFRS financial measures, specifically Adjusted EBITDA (as such term is hereinafter defined), as well as supplementary financial measures such as annualized revenue and annualized adjusted EBITDA. The Company believes these non-IFRS financial measures are frequently used by lenders, securities analysts, investors and other interested parties as a measure of financial performance, and it is therefore helpful to provide supplemental measures of operating performance and thus highlight trends that may not otherwise be apparent when relying solely on IFRS financial measures.
Adjusted Earnings before interest, taxes, amortization and depreciation (“Adjusted EBITDA”), is calculated as income from operating activities plus amortization and depreciation and stock-based compensation expense. The most directly comparable IFRS measure is income from operating activities.
The reconciliation of Adjusted EBITDA to the income from operating activities is as follows:
|
Q2 2024 $ |
Q2 2023 $ |
Q1 2024 $ |
|
| Income from operating activities | 247,709 | 116,662 | 186,709 |
| Amortization and depreciation | 138,893 | 256,835 | 150,275 |
| Stock-based compensation | 21,294 | 12,587 | 24,818 |
| Adjusted EBITDA | 407,896 | 386,084 | 361,802 |
FORWARD LOOKING INFORMATION:
Certain information in this press release may contain forward-looking statements, such as statements regarding future expansions and cost savings and plans regarding future acquisitions and business growth, including anticipated annualized revenue or annualized recurring revenue run rate growth and anticipated consolidated Adjusted EBITDA margins. This information is based on current expectations and assumptions, including assumptions described elsewhere in this release and those concerning general economic and market conditions, availability of working capital necessary for conducting Nova Leap’s operations, availability of desirable acquisition targets and financing to fund such acquisitions, and Nova Leap’s ability to integrate its acquired businesses and maintain previously achieved service hour and revenue levels, that are subject to significant risks and uncertainties that are difficult to predict. Actual results might differ materially from results suggested in any forward-looking statements. All forward-looking statements, including any financial outlook or future-oriented financial information, contained in this press release are made as of the date of this release and included for the purpose of providing information about management's current expectations and plans relating to the future, and these statements may not be appropriate for other purposes. The Company assumes no obligation to update the forward-looking statements, or to update the reasons why actual results could differ from those reflected in the forward-looking statements unless and until required by securities laws applicable to the Company. Additional information identifying risks and uncertainties is contained in the Company's filings with the Canadian securities regulators, which filings are available at www.sedarplus.com.
CAUTIONARY STATEMENT:
Neither TSX Venture Exchange nor its Regulation Services Provider (as that term is defined in the policies of the TSX Venture Exchange) accepts responsibility for the adequacy or accuracy of this release.
Photos accompanying this announcement are available at
https://www.globenewswire.com/NewsRoom/AttachmentNg/5c4aa1aa-cdc2-4f90-bb87-0145b38f093d
https://www.globenewswire.com/NewsRoom/AttachmentNg/af06e118-e093-4af7-973f-7ec100acc161

For further information:

                    Chris Dobbin, CPA, ICD.D
                    Director, President and CEO
                    T: 902 401 9480
                    E:cdobbin@novaleaphealth.com
![]()
Revenue in USD $

Revenue in USD $
Adjusted EBITDA & Operating Income (Loss) in USD $
Adjusted EBITDA & Operating Income (Loss) in USD $
EIN Presswire does not exercise editorial control over third-party content provided, uploaded, published, or distributed by users of EIN Presswire. We are a distributor, not a publisher, of 3rd party content. Such content may contain the views, opinions, statements, offers, and other material of the respective users, suppliers, participants, or authors.